
12.2.2 Comparing journal characteristics
In addition to calculating the impact of specific journals or articles, Publish or Perish can also be used to compare a specific set of journals on a number of characteristics or test specific hypotheses on topics such as research collaborations.
Co-authorship patterns
Let's assume for instance that I want to test the hypothesis that North Americans tend to publish more co-authored papers than Europeans. I could conduct a large comparison of North American versus European academics, which would be quite time-consuming.
However, I can also look at this on a journal level, as it has been well-established that North American journals tend to have a larger proportion of North American authors, whilst European journals have a large proportion of European authors. This tends to be true in any discipline, but it is certainly the case the Social Sciences and Humanities whose research topics tend to be more location-bound than the Sciences.
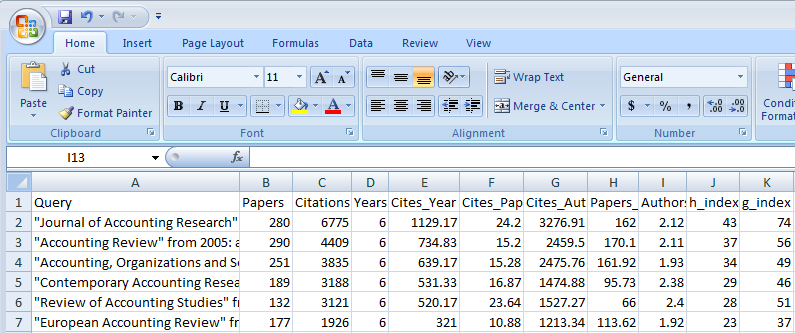
Referring to our earlier example of Accounting journals, of the six ISI-listed journals (see screenshot below), four are North America (JAR, AR, CAR and RAS), whilst the remaining two journals Accounting, Organizations and Society and European Accounting Review are European. Co-authorship patterns do indeed differ between the North American (2.11-2.40 authors per paper) and the European journals (1.92-1.93 authors per paper).
Of course this is only a very small sample of journals, but one could easily expand this to other journals in Accounting or Business in general and the same general pattern will be found. For instance if one compares Organization Science and Organization Studies, two journals in the field of Management with a very similar research domain, I find that the US-based journal has on average 2.27 authors per paper and the European journal 1.91 authors per paper, even when excluding book reviews (that typically only have one author).
Co-authorship patterns across disciplines
This same strategy can also be used to compare co-authorship patterns across disciplines. One could for instance take the top-3 journals in every discipline and calculate co-authorship patterns, rather than having to rely on a sample of academics in these disciplines. Doing this, one could not just look at the average number of authors per paper, but also at the number of paper with 1, 2, 3, and more authors as well as the modal number of authors per paper.
A very small-scale comparison looking at co-authorship patterns for articles published between 2005 and 2010 for the above two journals with two top journals in the Sciences and the Humanities already shows very interesting results. Please note that book reviews and other idiosyncratic results (e.g. call for papers, conference announcements, obituaries, apparent Google Scholar parsing errors) were excluded before reporting.
| Journal title | Mean | Mode |
|---|---|---|
| Environmental History | 1.08 | 1 |
| Evolutionary Anthropology | 1.39 | 1 |
| Organization Studies | 1.91 | 1 |
| Organization Science | 2.27 | 2 |
| Science | 4.52 | 5 |
| Nature | 4.64 | 5 |
Whilst in the Humanities sole authorship is the norm, in the Sciences papers typically have a much larger number of authors. Management as one of the Social Sciences falls between these extremes, but is much closer to the Humanities than to the Sciences.
Obviously, these results can also be useful if one wants to make a case for promotion to a panel that is comprised of academics from different disciplines. It helps to explain why it is not realistic to expect the same number of publications from academics in the Social Sciences and Humanities as from academics in the Sciences.
Co-authorship patterns over time
Another hypothesis that we could test is whether then number of co-authors tends to increase over time, reflecting the more collaborative and competitive nature of academic research and publishing in more recent times.
The table below presents co-authorships for the same set of journals as above for 2000-2004 instead of 2005-2010. Even over the limited time span of five years there has been a small, but noticeable increase in the number of authors for all disciplines, even the modal number of authors hasnt changed.
| Journal title | Mean 2000-2004 | Mean 2005-2010 | % increase in authors/paper | Mode both periods |
|---|---|---|---|---|
| Environmental History | 1.04 | 1.08 | 3.8% | 1 |
| Evolutionary Anthropology | 1.31 | 1.39 | 6.1% | 1 |
| Organization Studies | 1.83 | 1.91 | 4.4% | 1 |
| Organization Science | 2.02 | 2.27 | 12.4% | 2 |
| Science | 4.28 | 4.52 | 5.6% | 5 |
| Nature | 4.19 | 4.64 | 10.7% | 5 |
Concentration versus uncitedness
A second journal characteristic that might be worthy of bibliometric research is the level of concentration of citations versus the level of uncitedness. The concentration of citations is can be measured in a variety of ways. One way is to calculate the percentage of papers required to account for say 50% of the citations in a journal.
Those unfamiliar with citation analysis might be surprised at how low these percentages generally are. An analysis conducted on ISI Essential Science Indicators (Science Watch, 1999) showed that depending on the discipline only 5-10% of the papers accounted for 50% of the citations. The Social Sciences & Humanities generally had a stronger concentration of citations than the Sciences.
The level of uncitedness is the number of papers that after a time has lapsed have not been cited at all. The same analysis as above shows that for a 17 year period (1980-1997) this varies from 13%-15% for Immunology, Biology, Neuroscience and Astrophysics to 38%-45% for Economics & Business, Engineering, Education and Computer Science.
Obviously, these differences are partly caused by the fact that citations in the latter fields take much longer to pick up, hence recent papers in these fields will have very few citations. In addition, the rather poor coverage of ISI in the Social Sciences and Engineering means that many citations in non-ISI listed journals, book chapters and conference proceedings are not picked up.
Google Scholar versus ISI analysis of concentration and uncitedness
In order to address these drawbacks, one can conduct the same analysis on a journal level using Publish or Perish. At present, the analyses cannot yet be conducted in Publish or Perish itself, but the easy exporting of data to Excel (see Section 2.3) makes it possible to conduct these analyses relatively quickly. Please note that book reviews and other idiosyncratic results (e.g. call for papers, conference announcements, obituaries, apparent Google Scholar parsing errors) were excluded before exporting the results to Excel.
Science and Nature publish so many papers that when doing an analysis like this, we run into the Google Scholar restriction of 1000 maximum results. This means both that the level of concentration and the level of uncitedness for these journals would be underestimated as only the 1000 most-cited papers would be included. I have therefore substituted Science and Nature with two other journals: Biological Review and Endoscopy.
As the table below shows, the level of concentration is not as strong as in the ISI-based analysis, where 5-10% of the papers provided 50% of the citations. However, I still find that only 6-17% of the papers provide 50% of the citations and that concentration is generally stronger in the Social Sciences and Humanities (average 10.6%) than in the Sciences (average 16.1%).
| Journal title | Concentration: % of papers providing 50% of citations | Uncitedness: % of uncited papers |
|---|---|---|
| Environmental History (2000-2004) | 16.0% | 0% |
| Evolutionary Anthropology (2000-2004) | 6.1% | 28% |
| Organization Studies (2000-2004) | 12.0% | 0% |
| Organization Science (2000-2004) | 8.5% | 0% |
| Biological Review (2000-2004) | 17.1% | 0% |
| Endoscopy (2000-2004) | 15.1% | 5% |
This lower level of concentration might be caused by two reasons. First Google Scholar has a broader coverage and hence includes citations from a wider range of sources. Second, I looked at citations in 2010 to papers published in 2000-2004. Hence our analysis gave papers more time to gather citations, which especially in the Social Sciences and Humanities will reduce the level of concentration.
The broader coverage and longer time-frame also explains why our proportion of uncited papers is much smaller than in the ISI based analysis. For most journals, every paper had at least one citation, so 6-10 years after publication there were no uncited papers. There was only one journal (Evolutionary Anthropology) with a significant number of uncited papers, but with 28% even this proportion is much lower than for the ISI based analysis.