
12.2.1 Evaluating the citation impact of journals
As indicated above, ISI coverage differs substantially by discipline. Butler (2006) analysed the distribution of publication output by field for Australian universities between 1999-2001. For the Chemical, Biological, Physical and Medical/Health sciences between 69.3% and 84.6% of the publications were published in ISI listed journals, this was the case for only 4.4%-18.7% of the publications in the Social Sciences such as Management, History Education and Arts.
ISI estimates that of the 2000 new journals reviewed annually only 10-12% are selected to be included in the Web of Science (Testa, 2004). Publish or Perish can therefore be very helpful if you want to assess the citation impact of a list of journals that are not ISI listed or even for journals that are ISI listed if your university does not have a subscription to ISI.
What metrics to use?
Publish or Perish offers a wide range of metrics. However, not all of them will be equally useful to evaluate the impact of journals. The screenshot below show the initial Publish or Perish results for the top journal (in terms of ISI Journal Impact Factor) for Industrial Engineering (Technovation).
It shows the same metrics as for an author impact search. However, for a journal impact search, you are probably less interested in metrics that correct for the number of authors or the recentness of citations. The number of co-authors for articles is not very relevant when evaluating journals, although one might be interested in comparing co-authorship patterns across journals (see Section 12.2.2). The speed at which citations pick up is mostly a function of the discipline. If one wanted to remove the impact of different journal ages, one can easily limit the search to a particular time period.
This leaves us with four metrics: cites/year, cites/paper, h-index and g-index. The cites/year metric is probably less useful as it is heavily dependent on the number of papers a journal publishes. Some journals might publish as few as 5 papers a year, whilst others might publish well over 200 papers a year. The cites/paper statistic is closest in nature to Thomsons Journal Impact factor as it measures the average number of citations a typical paper in the journal receives, although using an expanded time period.
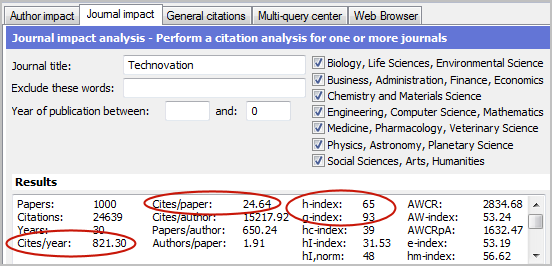
Typically the h-index and g-index are very highly correlated for journal searches. In the example of 16 accounting journals in Chapter 9, the correlation was 0.982; for an extended group of 536 journals in Business & Economics (see Chapter 15) it was 0.976. Therefore, for journals we can use these two indices interchangeably. Both the h-index and the g-index include an element of volume (number of papers) as well as impact (number of citations). This could be seen as a disadvantage as a journal cannot have a high h-index or g-index if it only publishes a very limited number of papers, regardless of how well they are cited. If a journal would publish only 5 papers a year, after 10 years its h-index could at a maximum of 50, even if all papers were cited 100 times or more.
However, this is an unlikely extreme and the h-index does not reward journals that publish a lot of papers per se, as they still need to be cited to enter into the h-index. Furthermore, one can easily argue that when evaluating the impact journal, it doesn't just matter how many citations the average paper has, but also how big the body of research is that the journal has created. Theoretically, a journal could have a very high citation per paper rate by being extremely selective and publishing only a few papers a year. However, this journals overall impact on the field would still be limited.
h-index versus cites/paper
Hence, I would argue that the “cites per paper” and the h-index are probably the two best metrics to use to evaluate journals. They are also to some extent complimentary as the “cites per paper” metrics only focuses on impact and the h-index focus both on volume and impact. However, the added advantage of the h-index is that it is a more “robust” measure, which is not so dependent on small errors in the data source in question.
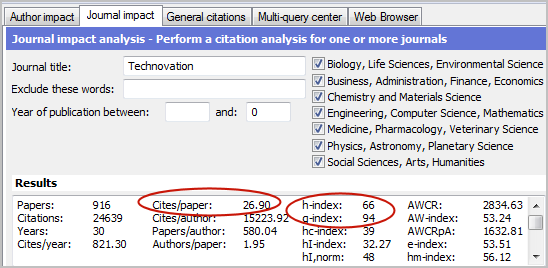
The “cites per paper” measure on the other hand is very dependent on the number of stray citations (citations with minor errors that are displayed as separate references), the type of material included in the journal and the number of papers. Stray citations reduce the average number of citations per paper. A lot of book reviews and conference notes (that are normally not cited) also reduce the number of citations per paper. On the other hand, journals that publish a lot of papers per year and/or have been in existence for a long time will easily run up against the maximum number of results returned by Google Scholar (1000) as is evidenced in the Technovation example. This means that only the 1000 most cited papers are returned, thus inflating the “cites per paper” metric.
Returning to our Technovation example, I manually cleaned up the results by merging stray citations into their master records and removing publications that were clearly book review, call for papers or conference notes as they are typically not cited. Cleaning up the results is relatively easy if one sorts by title or author. Reviewing the publications with 0 cites also helps, as they contain many book reviews, conferences notes or similar.
The screenshot below shows that the h-index and g-index for Technovation have changed very little. They increase by only 1 each, an increase of only 1-1.5%. Bontis & Serenko (2009) find identical results in their study of journals in knowledge management. However, the “cites per paper” metric has changed more significantly, from 24.64 to 26.61, an increase of nearly 10%. Although cleaning the results is not terribly time-consuming, it might take 5-15 minutes per journal. Hence, if one wanted to measure the impact of more than a handful of journals it might be better to simply stick to the h-index.
Sensitivity of cites/paper metric
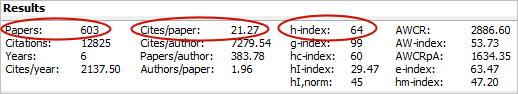
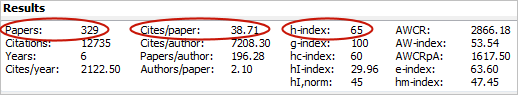
If one does want to include the cites per paper metric, it is very important to be conscientious in merging stray citations and removing non-article publications, especially when dealing with a limited number of results. The screenshots below show the results for the Academy of Management Review for publications from 2005 onwards, both for the initials results and for the cleaned results.
In the cleaned results the number of papers was reduced drastically by removing book reviews (an important feature of this journal) and merging stray citations. This did not have a significant impact on the h-index, which increased only by 1. Most of the other metrics didn't change much either. However, it did nearly double the number of citations per paper. Again, this shows that the h-index is a relatively robust index, whilst the “cites per paper” metric requires careful manipulation of the data to provide reliable estimates. Hence, I would suggest that the h-index is probably the most appropriate way to measure journal impact.
Examples of journal impact analysis
Many academics have used Publish or Perish to do an impact analysis of journals or articles and provide ranking of journals in their specific field. Below, I discuss a very small selection of these efforts to give you an idea how you can use PoP to do bibliometric analysis for journals. A more detailed example of how to use Publish or Perish to assess journal impact can be found in Chapter 15 (A Google Scholar h-index for journals).
Most of these examples are in the broad field of Economics & Business. This is probably partly caused by the fact that I am working in this field myself and hence academics are more likely to send me papers in this area. However, it also reflects the fact that Google Scholar and Publish and Perish provide a more comprehensive assessment of research impact in this field (for more details see Chapter 16). However, the basic topics and methods described in these papers are equally applicable in other disciplines.
Many of the articles discussed below compare different sources of citation data or compare journal rankings based on stated preference with journal rankings based on revealed preference. Stated preference involves members of a particular academic community ranking journals on the basis of their own expert judgments. These are often undertaken by particular universities or departments in order to help make decisions about, for example, library budgets, promotion or tenure, and national research evaluations, such as the Research Assessment Exercise (now Research Excellence Framework) in the UK.
Revealed preference rankings are based on actual publication behavior and generally measure the citation rates of journals using Thomson ISI's Web of Knowledge. Most commonly used are the ISI Journal Citation Reports, which provide the yearly Journal Impact Factors (JIF). However, any source of citation data can be used. Publish or Perish is ideally suited to measure the impact of journals with Google Scholar data.
Stated and revealed preference for Journals in Knowledge management
Bontis & Serenko (2009) compared stated preference and revealed preference for journals in the field of Knowledge management. In order to measure revealed preference the authors calculated Google Scholar h-indices and g-indices using Publish or Perish. Their results find a very strong correlation (0.813, p < 0.001) between the ranking of journals based on stated preference created in a previous study and the ranking based on revealed preference as reported in this study.
The authors used Google Scholar/PoP in their revealed preference study for several reasons. First the field includes practitioners who contribute actively to books and journals, but cannot afford access to the subscription-based ISI Web of Knowledge. Second, the more comprehensive coverage of Google Scholar is beneficial for this relatively new field as none of the twenty main outlets ranked in an earlier study by the authors is ISI listed. Finally, Google Scholar also does a better job in providing coverage of the work published by the many scholars from non-English speaking countries in this field.
German research in business administration
Breuer (2009) uses PoP to provide an evaluation of German research in Business Administration. I discussed the results of this paper with regard to German academics. With regard to journals, he concludes that Google Scholar is much more useful than ISI's Web of Scinece for German business administration because of its much broader coverage of potential publication outlets. Again though, this paper shows that rankings of ISI listed journals according to the ISI citation data are highly correlated with rankings according to Google Scholar.
Core journals in education and their impact on scholarship and practice
Goodyear et al. (2009) looked at 126 education journals, with a special focus on 11 core journals. They compared ISI journal impact factors with ISI h-index and GS h-index. The authors found the GS h-index to correlate well with the other ISI impact measures. However, they identify two advantages of the GS h-index that are also signalled in this book.
First, Google Scholar (PoP) is available at no cost and therefore is available to anyone with a computer and Internet connection. Second, Google Scholar and PoP can provide impact data for those journals not indexed by ISI. The article also showed that the impact on scholarship was ranked higher for the 11 core journals than the impact on policy and practice.
What's new in Finance
In What's New in Finance? Matti Keloharju (2008) uses Publish or Perish to prepare a list of the 300 most cited articles published in the area of Finance during the period 20002006. Rankings are based on the ratio of the number of citations and the number of years since publication. He finds that empirical papers tend to be more highly cited than theory papers and that highly cited papers tend to have a larger number of authors.
He also reports that corporate finance and governance papers are over-represented in the most cited articles and that academics affiliated with top US institutions such as University of Chicago, Harvard Business School, Harvard University, New York University, University of Pennsylvania, Stanford University, Duke University and Massachusetts Institute of Technology publish a disproportionate number of the most-cited papers. Overall, 86% of the highly-cites articles were authored by researchers based in North American institutions.